Written by:


Last Published:
26 July 2026
•
R vs Python is the question that lands on every data team eventually, and it is a fair one. Both are open-source, both are among the most popular data science languages, and both excel at data analysis. The honest answer to which you should use is that it depends on what you are building: choose R when the output is statistical analysis and publication-quality visualisation, and Python when the output is a model that has to run in production alongside the rest of your software.
Think of R as a precision bench in a laboratory, everything laid out for measurement and the results clean enough to publish. Python is the workshop next door, with a loading bay at the back, where whatever you build can be wheeled straight out to a customer. This article covers how the two differ across data handling and machine learning, the four-question stack test we use with clients to pick one, and what that decision costs in hiring, maintenance and time-to-value.
In short:
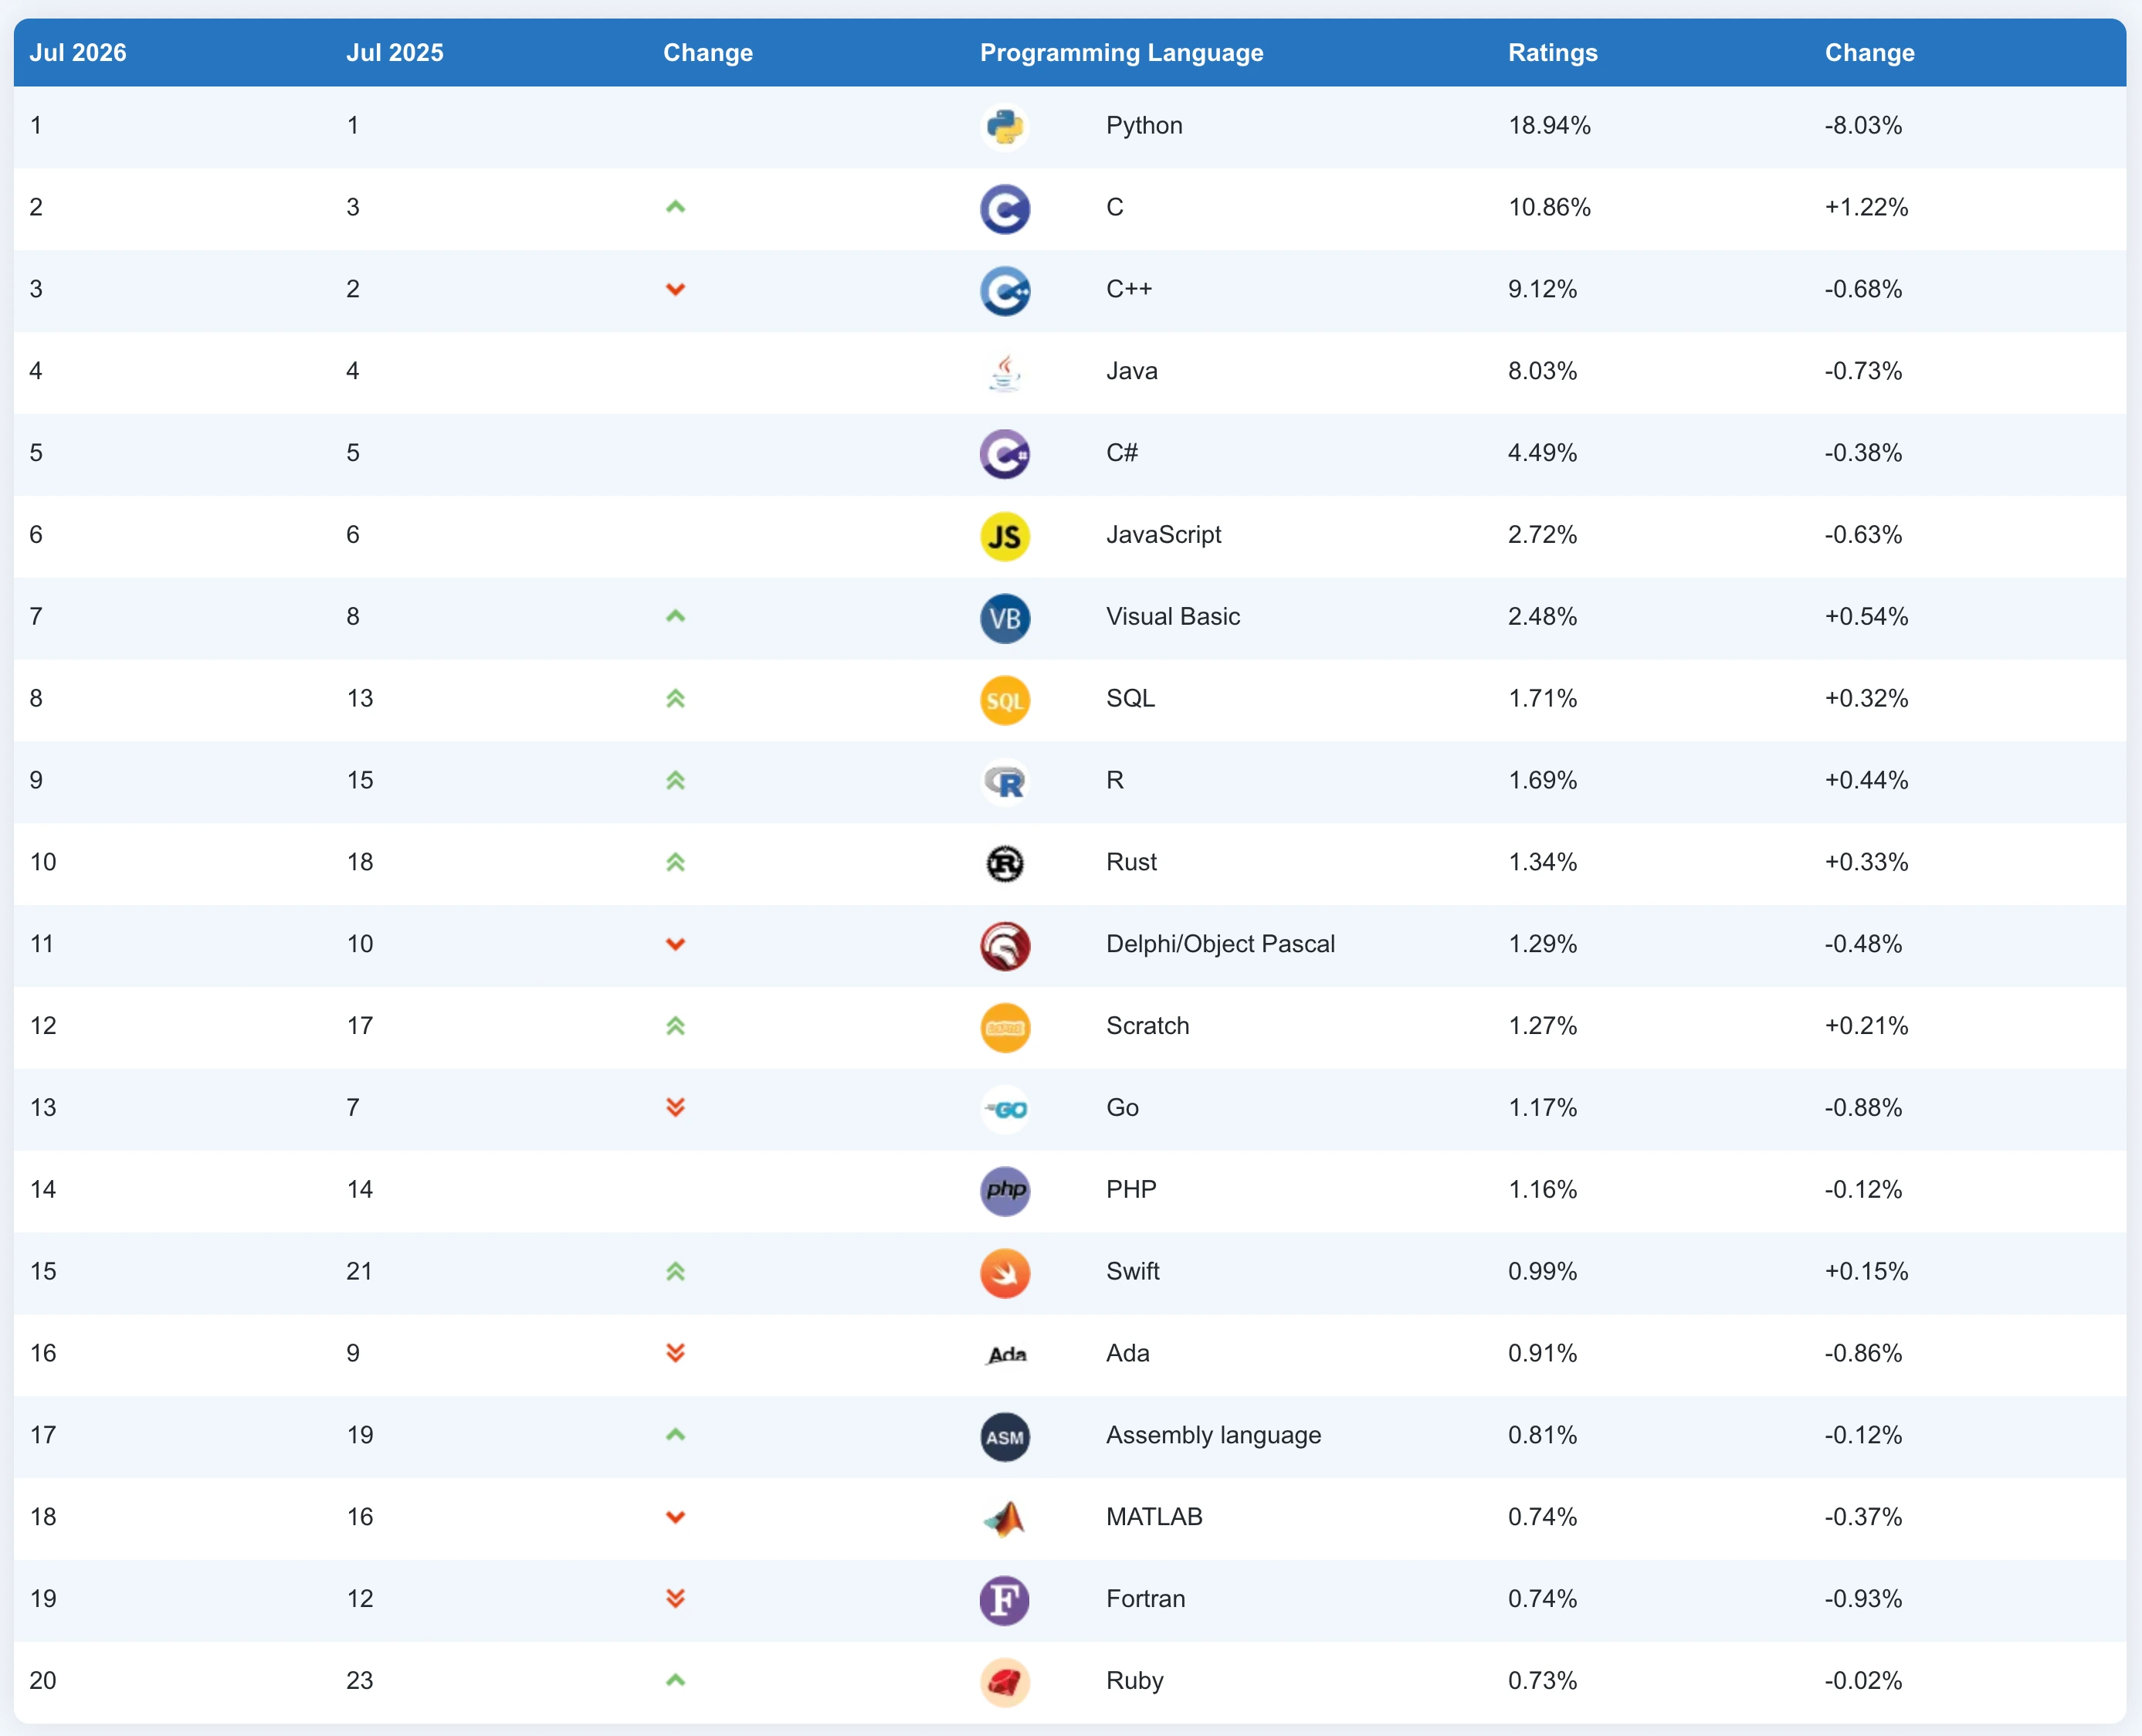
R is a programming language and environment built for statistical computing, data analysis and graphics. It is more visible than it has been in years: on the TIOBE Index it climbed to 8th place in 2026, its best-ever position, as statistical work consolidates around a shorter list of languages.
The software was first introduced in 1993, designed by Ross Ihaka and Robert Gentleman. Since then it has built a strong reputation for handling data science, visualisation projects and statistics, and it is supported by more than 22,000 packages on CRAN, its central package repository.
Unlike Python, which we cover next, the R language was developed exclusively to analyse data and to build applications and software solutions that execute statistical analyses and data mining. It is a complete ecosystem for data analysis, with a wide variety of packages and libraries available. Back to the bench: every drawer is already labelled for the work.
Python is one of the world's most popular programming languages. It was initially introduced in 1991, designed by Guido van Rossum. It has spent years cementing itself as the default language of data work, and the gap has only widened.
In the Stack Overflow Developer Survey 2025, among developers who use generative AI every day, 82% write Python and just 3% write R, a split that tells you where the tooling, the tutorials and the hiring now point.
Python's popularity does not come exclusively from data science. This multi-paradigm language also provides a large number of libraries and tools for software development, artificial intelligence (AI) and machine learning (ML). As a general-purpose language, it covers the whole path from a first exploratory notebook to a deployed service. That is the single biggest reason it dominates in production environments. The loading bay again, and it matters more than most feature lists admit.
Purpose is the core difference between these two languages. R's primary purpose is statistical analysis and data visualisation. It relies heavily on statistical models and does not require many lines of code to produce its analytics output, which is exactly what makes it popular among researchers, engineers, statisticians and other professionals without software engineering skills.
Researchers often prefer R because it provides plots and graphics that can immediately be used for publication, with the correct mathematical formulae and notation. R also handles graphs, charts and plots well, and that makes it easier to interpret data and to spot patterns, outliers and trends in datasets.
Python was built as a general-purpose language and only later became a data science tool. That history is why it carries the whole software lifecycle with it: testing, packaging, deployment and monitoring. It does require software engineering skills, but the readable syntax keeps it reasonably easy to learn.
Python is mainly used by developers to perform data analysis and to run machine learning in production environments. Plus, it gives you the flexibility to build new models from scratch, since it integrates with every stage of the development process.
The implication for your team is straightforward. The language that matches your deliverable needs less scaffolding around it, and scaffolding is where budget quietly disappears.
Python is more versatile than R when it comes to data collection. It supports every kind of data format (for instance, CSV and JSON files), and it makes retrieving data from the web straightforward through the Python Requests library. Importing SQL tables into Python code is equally routine.
R imports files from CSV, Excel and text files. It is not as direct as Python when it comes to retrieving data from the web, though the Rvest package handles basic web data extraction. SPSS and Minitab files can also be converted to R data frames, the tabular structure R uses to hold a dataset in memory.
In practice this difference matters most at the edges of a pipeline. If your data arrives through APIs, message queues or a cloud warehouse, Python will need less glue code around it.
R illustrates the results of statistical analyses with plots, charts and graphs, and it does so with less code than the alternatives. For more advanced plots, data scientists can use ggplot2, one of the most popular R packages, which implements a grammar of graphics. Almost any type of graph is buildable with this tool, and ggplot2 lets users change components within a plot at a high level of abstraction.
Python is not as strong as R on statistical visualisation, although the gap has narrowed. Python users can rely on the Matplotlib library, which enables interactive figures and several types of plot (histograms, scatter plots, 3D plots and others), with Seaborn and Plotly layered on top for statistical and interactive charts.
So which should you reach for? If your charts end up in a paper or a board pack, R gets you there faster. If they end up inside a product, Python keeps them in the same codebase as the application that serves them.
There are several libraries available for different methods of data manipulation. For data aggregation, R users can rely either on the integrated data frame type or on dplyr, a library that is part of the Tidyverse, a collection of R packages that share a common design for data work. For reshaping data, the tidyr library, also part of the Tidyverse, is a good R solution.
Python users get Pandas, a single library, for several methods of data manipulation. Pandas is a popular open-source tool for handling data analysis and managing data structures.
One library rather than several is a practical advantage when a new joiner has to read someone else's code. Onboarding cost is a real line item on any team that turns over, and it rarely shows up in a feature comparison.
Pandas is also a widely known tool for data exploration in Python, on top of the manipulation work. It is the primary data analysis library for Python, and it allows users to filter, sort and display data easily, enabling effective statistical and data mining treatment within a dataset.
R offers a wide variety of options to conduct data exploration and apply data mining techniques. It manages basic data analysis, such as clustering and probability distributions, without requiring the installation of additional packages. It also has readily usable statistical tests and a formula syntax for expressing models.
Exploration is the one dimension where the choice rarely matters much. Whichever your analysts already know is the one that will produce answers this week.
Data modelling consists of creating models that establish how data is to be stored and represented. Python offers several solutions for data modelling, according to the specific purpose of each dataset. For instance:
The R language may have to rely on external packages, such as the Tidyverse, to perform more specific modelling analyses. Base-R, the basic software that includes the R language, covers the primary data modelling analyses without any installation at all.
For classical statistical models, R gets there with no dependencies to manage. For anything that will be retrained on a schedule, Python's libraries are the ones the surrounding tooling already expects.
Is either language fast? Not really. Both are interpreted, and both get their speed by pushing heavy work down into compiled libraries: NumPy and Pandas in Python, and vectorised operations and C or Fortran routines in R.
The differences appear once a dataset stops fitting in memory. R is memory-hungry and traditionally copies objects on modification, though data.table and the arrow package handle large tables efficiently. Python has a larger set of options for scaling out, including Dask, PySpark and direct connectors to distributed engines, which is why it turns up more often in pipelines that process data at warehouse scale.
If you expect datasets in the tens of gigabytes or larger, the practical question is not which language is faster. It is which one has a supported path to a cluster. Today that is more often Python.
R's ecosystem is deep rather than broad. CRAN holds more than 22,000 packages, and its strength is concentrated in statistics, biostatistics, econometrics and visualisation, with Bioconductor adding a specialised set for genomics. Packages are reviewed and must pass checks before publication, which keeps quality high.
Python's PyPI holds more than 600,000 packages and covers everything from web frameworks to deep learning. Data work sits alongside every other kind of software rather than in its own world. The trade-off is variable quality and more dependency management.
The practical consequence is about who you can ask for help. An obscure statistical method is more likely to have an R implementation and an academic behind it. An obscure infrastructure problem is more likely to have a Python answer already written down.
An IDE, or integrated development environment, is a software application that allows developers to write, test and debug code more easily by enabling code completion, code highlighting, debugging tools and similar features.
Python offers various IDEs to choose from, the most popular being Jupyter Notebooks, Spyder and PyCharm. R is also compatible with Jupyter Notebooks, but the most used R solution is RStudio. RStudio comes in two formats: RStudio Server, accessed through a web browser, and RStudio Desktop, which runs as a regular desktop application.
RStudio is the better environment for analysis, and that is part of the problem. It is so self-contained that R work often develops outside the engineering team's tooling, including its version control and review habits.
Python and R both support deep learning libraries. Among the most widely used are PyTorch and TensorFlow, machine learning libraries used to develop deep learning models, with a particular focus on deep neural networks, the layered models behind most modern AI systems. If you are weighing those two up specifically, we have compared PyTorch vs TensorFlow in detail.
Most AI features and libraries were introduced in Python first and in R afterwards. Both R and Python are compatible with TensorFlow and Keras, another library for artificial neural networks, and the torch for R ecosystem, which arrived in September 2020, includes torch, torchvision, torchaudio and other extensions.
Does the lag matter? It does if your roadmap depends on recent research. New model architectures reach Python first, and R bindings follow later, if at all.
| Dimension | R | Python |
|---|---|---|
| Original purpose | Statistical analysis and graphics | General-purpose programming |
| First released | 1993 | 1991 |
| Primary users | Statisticians, researchers, analysts | Developers, ML engineers, data scientists |
| Data collection | CSV, Excel, text, SPSS, Minitab; Rvest for the web | Every common format; Requests for the web; direct SQL |
| Data visualisation | ggplot2, publication-ready statistical plots | Matplotlib, Seaborn, Plotly |
| Data manipulation | dplyr, tidyr, data frames | Pandas |
| Modelling libraries | Base-R, Tidyverse, external packages | SciPy, NumPy, SciKit-learn |
| Performance at scale | Memory-hungry; data.table and arrow for large tables | Dask, PySpark and connectors to distributed engines |
| Ecosystem | CRAN, 22,000+ packages, deep in statistics | PyPI, 600,000+ packages, broad coverage |
| Deep learning | TensorFlow, Keras, torch for R (since 2020) | PyTorch, TensorFlow, Keras, first to receive new features |
| Main IDE | RStudio | Jupyter Notebooks, PyCharm, Spyder |
| Production deployment | Limited; usually needs a rewrite or a service wrapper | Native; deploys with the rest of your stack |
| Learning curve | Gentle for analysts, steep for advanced analytics | Gentle overall, requires programming basics |
Feature comparisons rarely settle the argument, because both languages can do most of the work. This is the test we run with clients when we are asked to help set a data stack, and it comes out of years of building data and machine learning products for teams in fintech, healthtech and retail. Four questions decide it faster than any feature table.
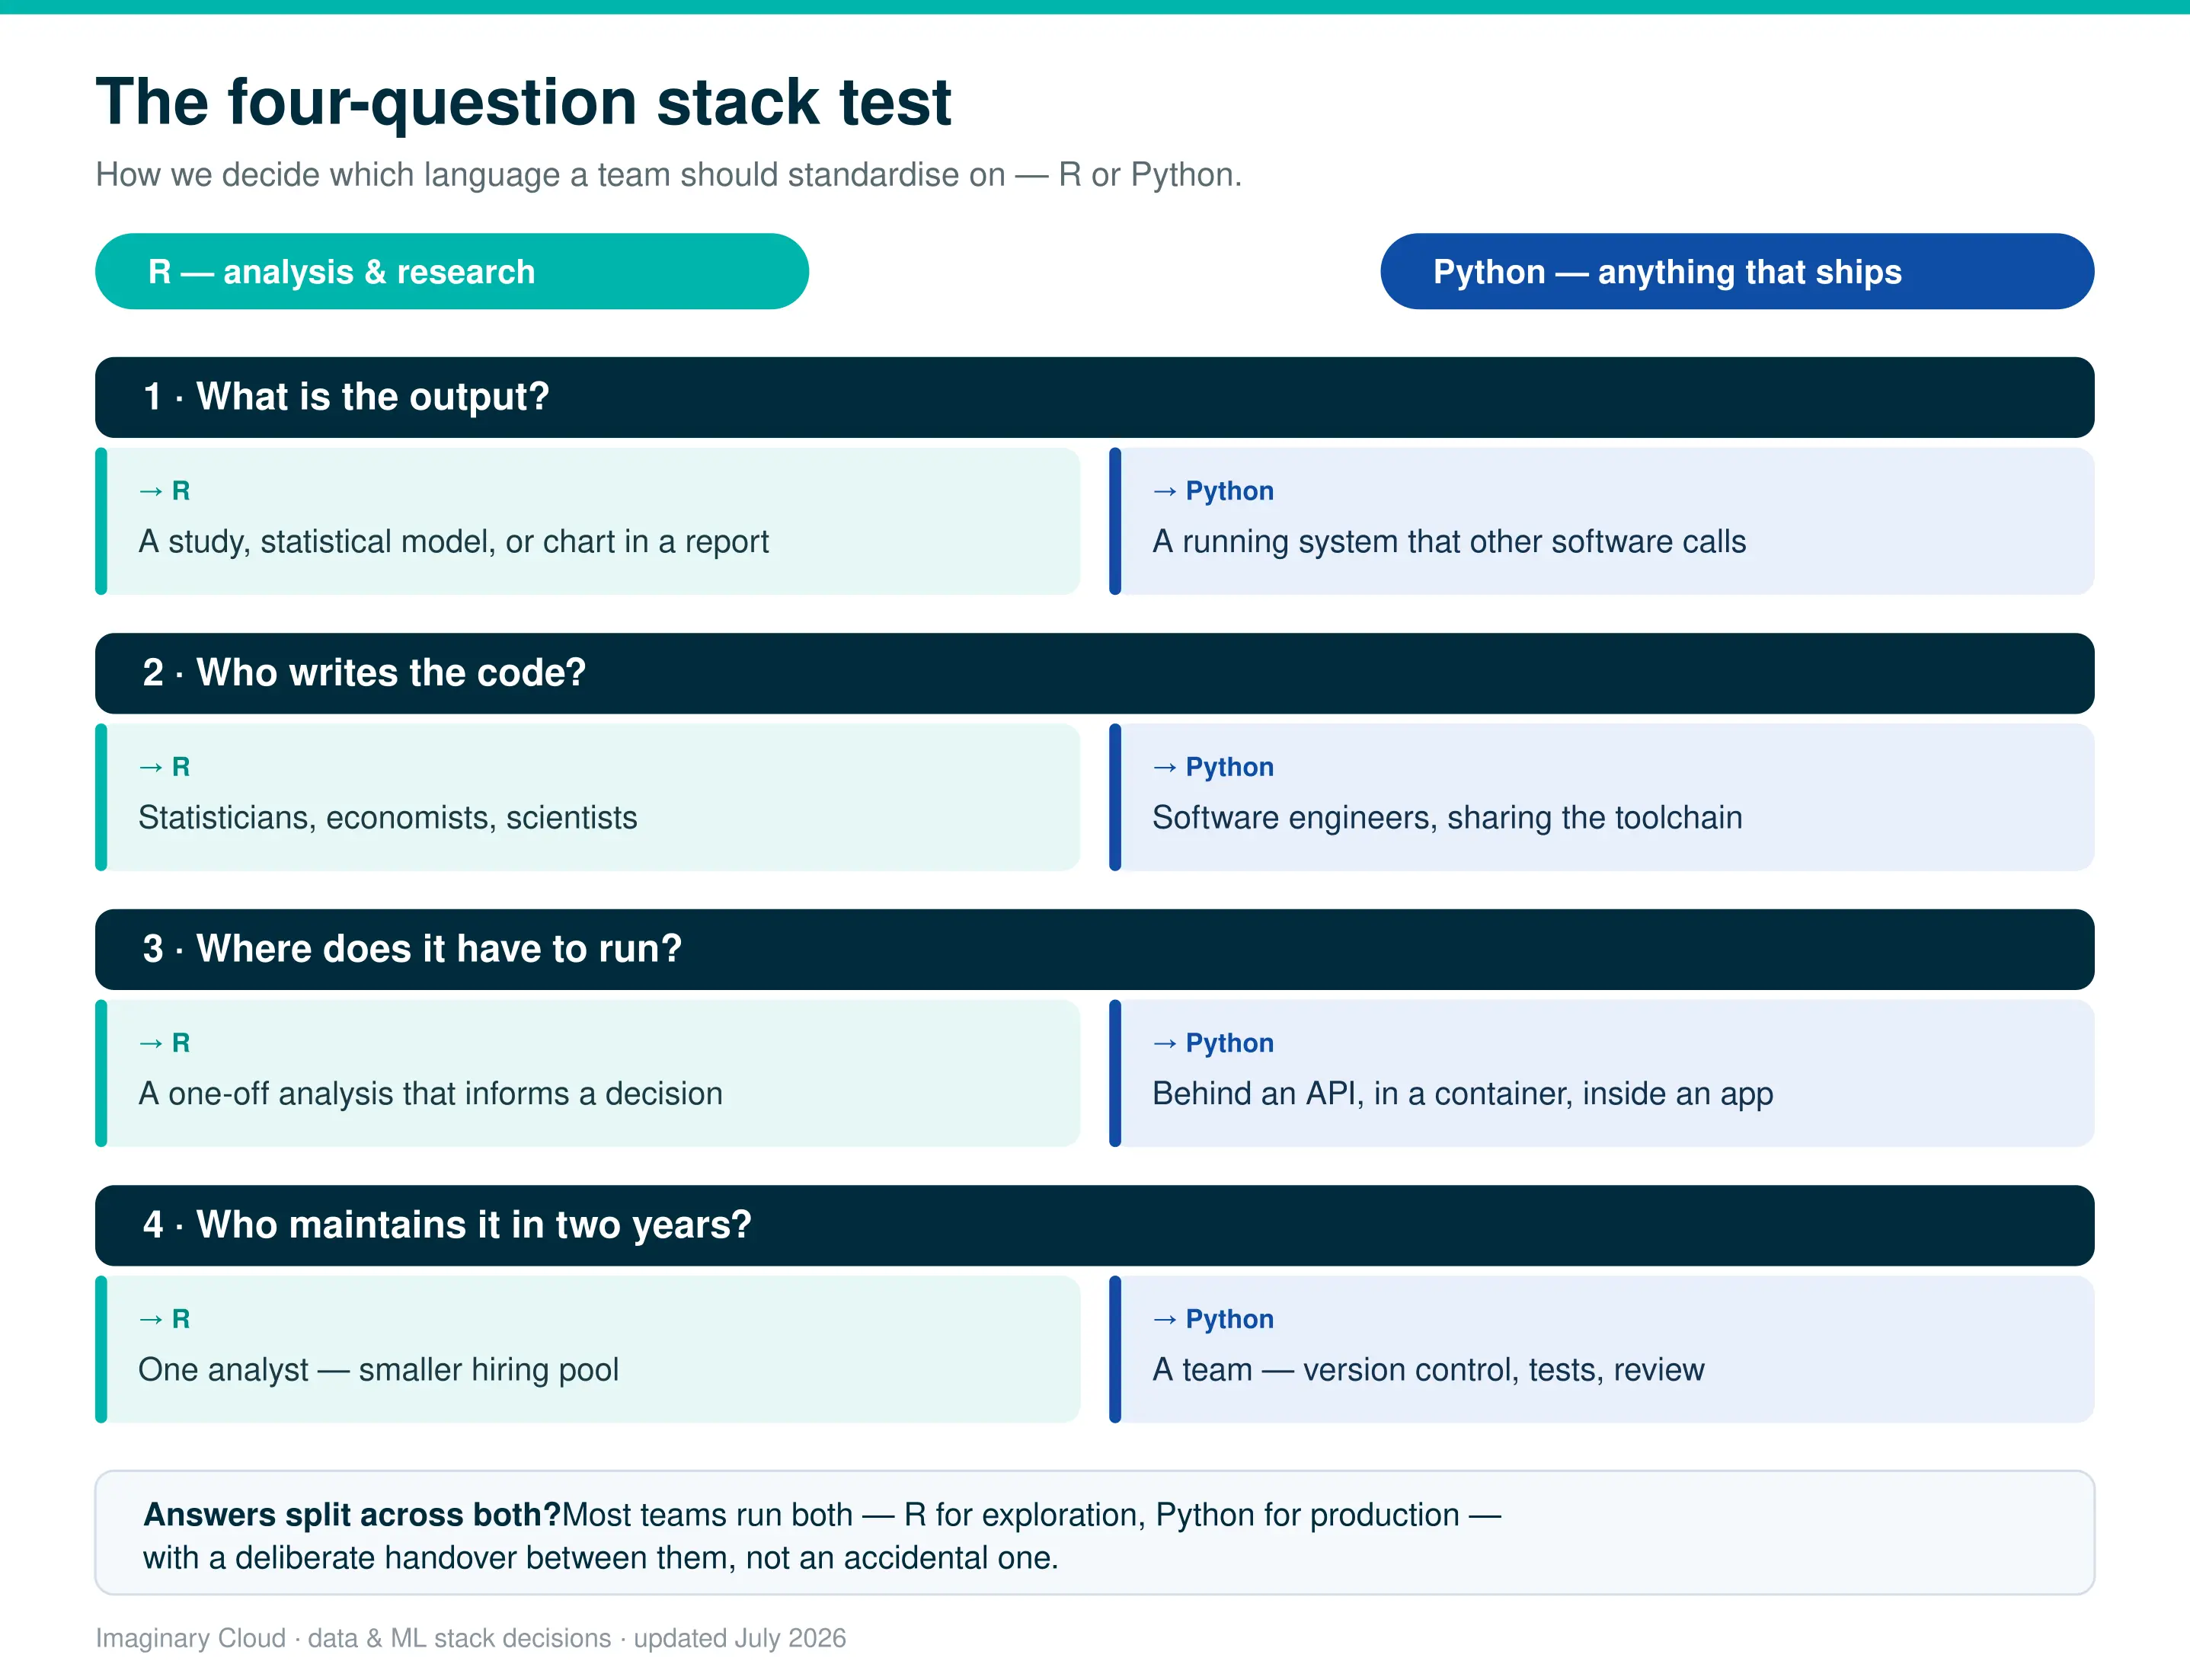
What is the output? If the deliverable is a study, a statistical model or a chart in a report, R is the shorter path. If the deliverable is a running system that other software calls, Python is.
Who writes the code? If your data work is done by statisticians, economists or scientists, R matches how they already think. If it is done by software engineers, Python matches the rest of their toolchain.
Where does it have to run? If the model has to sit behind an API, in a container, or inside an existing application, Python removes an entire migration step.
Who maintains it in two years? This is the question teams skip. An R script written by a departing analyst is harder to staff than the equivalent Python module, simply because the hiring pool is smaller.
One pattern comes up again and again in delivery work. An R prototype proves a business case, then has to be rewritten in Python before it can go live, and the rewrite gets scoped as if it were a translation exercise. It is not. Statistical behaviour has to be validated again, package equivalents rarely match one-to-one, and in our experience a rewrite of a modest model typically adds four to eight weeks that were never budgeted. If there is any chance the prototype will ship, prototype in the language it will ship in.
We saw this play out building the Multidimensional Progress Index tool for Eurofound. The MPI is a composite index that scores EU member states across six socio-economic, digital and environmental dimensions, and it lets users re-weight each dimension and watch the score recalculate live. That is statistical work, but it had to live inside an interactive product people could use in a browser. So the index logic ran on a Python and Flask back end, with a React front end and Recharts for the visualisations, rather than sitting in a separate statistical script that would later need porting. The analysis and the thing that shipped were the same codebase. That is the Python case in a single project: when the output is a running tool rather than a one-off study, standardising on the language it deploys in removes the migration step entirely.
The language decision is usually framed as a technical preference. It is a cost and risk decision.
Hiring. The talent pools are not comparable. In the Stack Overflow Developer Survey 2025, Python usage climbed to 57.9% of all developers, up seven points in a year on the back of the AI boom, while R stayed in low single digits. Recruiting for R usually means recruiting a specialist rather than drawing from your existing engineering pipeline, which lengthens time-to-hire and narrows the field of candidates who can also maintain the surrounding system.
Maintainability. R analysis code tends to be written by one person, for one question. When that person leaves, the code often goes with them. Python code written by an engineering team inherits the practices around it: version control, tests, code review and deployment pipelines.
Running two stacks. Many organisations do run both, and that is a legitimate choice. It is not a free one. Two stacks mean two sets of dependencies, two environments to secure and patch, and a handover point between analysis and engineering where errors quietly accumulate.
Time-to-value. For a first machine learning deployment, the fastest route is almost always Python, because the model does not have to cross a language boundary before it reaches users. On the projects we have delivered, the four to eight weeks a prototype rewrite adds is usually the difference between shipping in a quarter and shipping in two. For a one-off statistical study that informs a decision, R usually gets there sooner.
If you are working through this decision, our applied AI and machine learning team runs it with clients regularly, and our overview of what data science is and how it can help your business sets out where the value tends to come from.
Due to its easy-to-read syntax, Python is considered fairly easy to learn. It excels for readability and simplicity, so the learning curve is not steep. It is also a complete language and suitable for beginning developers, which means the time you invest transfers to work well beyond data science.
R is easier to learn for those without software engineering skills. It allows users to start running data analyses immediately, but it becomes more demanding as they move into advanced analytics and functionality. R is widely used by data scientists and by scientists in other fields, including biology, physics, management and engineering, who want to analyse data and produce graphics quickly from experiments and other research.
The aim of your analyses is the other thing to weigh. R is primarily recommended for those interested in statistical learning, data exploration and experimental design. Python is mainly used for data analysis within web applications and is the better option for machine learning. If you are comparing Python against other general-purpose options as well, our Python vs Java comparison covers that side of the decision.
R and Python aren't the only two contenders here, either. If your work leans toward heavy numerical or scientific computing rather than statistics or general-purpose development, it's worth also seeing how Julia compares to Python before you settle on a stack.
Neither is better across the board. R is better for statistical analysis, experimental design and publication-quality visualisation. Python is better for machine learning, production deployment and anything that has to integrate with other software. For most companies building products, Python is the safer default. For research and analysis teams, R often wins.
It depends on your starting point. R is easier for people who come from statistics and have no programming background, because it lets them run analyses almost immediately. Python is easier for anyone who already writes code, and its syntax is simpler to read once the work goes beyond basic analysis.
Standardising reduces cost and risk, but forcing it can backfire. A common arrangement is Python for everything that ships and R for exploratory and statistical work, with a clear handover point between the two. What matters is that the boundary is deliberate rather than accidental.
Yes, particularly for statistics-heavy roles in research, pharmaceuticals, economics and academia, where R remains the standard. It is less useful as a first language for someone aiming at a software engineering or ML engineering career.
Yes. The reticulate package lets R call Python code, and rpy2 lets Python call R. Teams also share data between them through files, databases or an API. Interoperability works, but it adds a dependency and a maintenance cost, so be deliberate about where the boundary sits.
Python. The major deep learning frameworks, PyTorch and TensorFlow, are Python-first, new research is published with Python implementations, and deployment tooling assumes Python. R has capable bindings, but it receives features later.
Python, in most cases. Both languages rely on compiled libraries for heavy work, but Python has a wider set of supported routes to distributed processing through Dask and PySpark. R handles large tables well with data.table and arrow, but the path to a cluster is narrower.
Despite competing for the title of "the number one language in data science", R and Python are very different, and that difference starts with their approach.
R stands out for statistical learning and provides a wide range of functionality for data analysis. It handles advanced analytics in data science and in other fields such as biology, management and physics. R users do not need software engineering skills, which makes it more accessible for researchers and scientists, and R excels at data visualisation.
Python's approach to data science is more concerned with production and deployment. It is primarily used for data analysis within web applications, it is the stronger option for machine learning, and it is well suited to data science pipelines.
So, which one? The decision is less about the languages than about your output, your people, your deployment target and your maintenance horizon. The bench or the loading bay. Work through the four-question stack test above and the answer is usually obvious.
Thinking about which language your data work should standardise on? We help companies design data and machine learning stacks they can maintain, hire for and deploy. Talk to our team about where you are heading.

Marketing Intern with a particular interest in technology and research. In my free time, I play volleyball and spoil my dog as much as possible.
Data Scientist with a deep passion for engineering, physics, and mathematics. I like listening to and making music, travelling, and riding mountain bike trails.
People who read this post, also found these interesting:
















.webp)
.webp)